
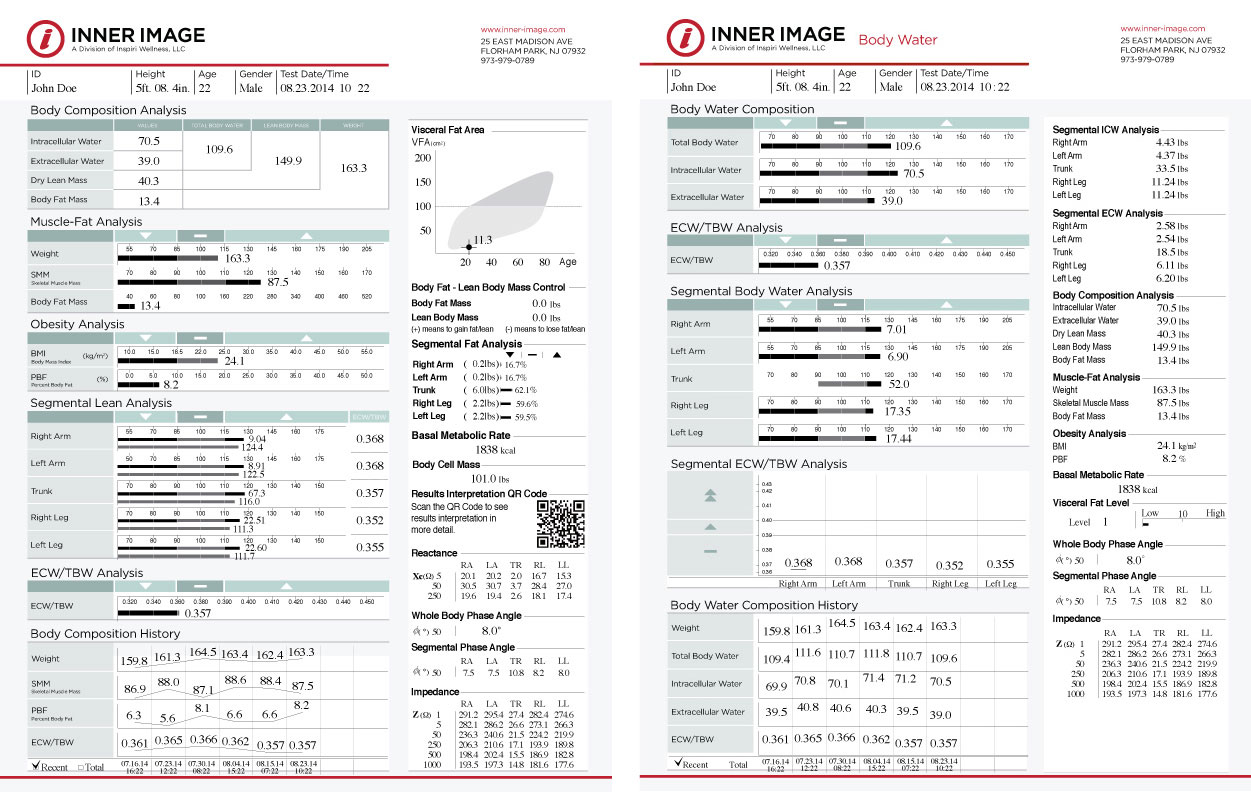
sample results sheets
The Inner Image body composition analysis reveals in crystallizing detail your muscular distribution, percentage body fat, and body water balance; components that are critical to understanding more about your body. The following definitions are provided to assist you in better understanding the values contained within your personal results analysis.
Body Composition Analysis (BCA):
Measurement and quantification of the four fundamental elements constituting the human body – water, protein, minerals, and fat – as the balance between them is essential to optimal health and performance.
Intracellular Water (ICW):
Water located within the cell, majority of body water is intracellular water and found within muscles and organs; associated with anabolic processes, greater Lean Body Mass, improved nutrient retention/use, and overall good cellular health and integrity.
Extracellular Water (ECW):
Water found outside the cell; abnormally high levels often indicative of excess body fat, inflammation and water retention related to trauma, injury, toxicity, or malnutrition.
Total Body Water (TBW):
Sum of Intracellular Water and Extracellular Water. TBW increases with Lean Body Mass, as muscle is approximately 73% water; fat is approximately 10% water.
Dry Lean Mass:
Sum total in pounds of protein and minerals present in the body.
Lean Body Mass (LBM):
Sum total of Total Body Water and Dry Lean Mass; also known as Fat Free Mass, which includes water, muscle, bone, connective tissue and internal organs.
Body Fat Mass:
Sum of subcutaneous fat (directly beneath the skin), visceral fat (internal abdominal region), and fat surrounding muscles; fats are responsible for storing energy, protecting the body, and helping regulate body temperature.
Muscle–Fat Analysis:
Metrics used to track body composition changes – as opposed to pure weight loss – with the desired outcome being an increase in Skeletal Muscle Mass and a decrease in Body Fat Mass. When comparing the graphic bar lengths of Skeletal Muscle Mass and Body Fat Mass, the longer the Skeletal Muscle Mass bar is compared to the Body Fat Mass bar, the stronger the body is.
Weight:
Sum total in pounds of the four components of body composition: total body water, protein, minerals, and body fat mass.
Skeletal Muscle Mass (SMM):
Weight in pounds of muscle attached to bone; responsible for movement, posture, and body temperature; muscle most easily affected through physical activity and exercise.
Obesity Analysis:
Exploration of the relationship between Body Mass Index and Percent Body Fat.
Body Mass Index (BMI):
Calculation of relative weight based on mass and height; also a height/weight index used to determine obesity classification, wherein BMI = Weight (pounds) ÷ Height2 (inches) x 703.
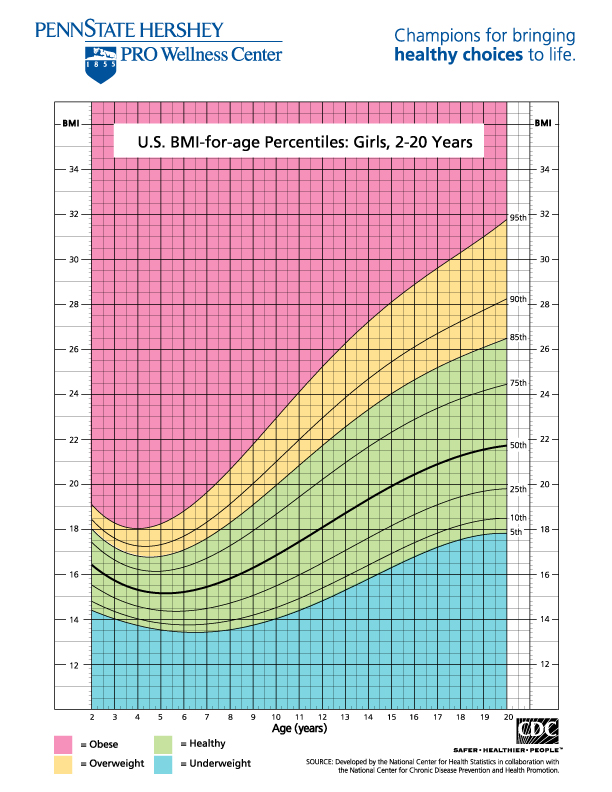
BMI Categorization for Adults:
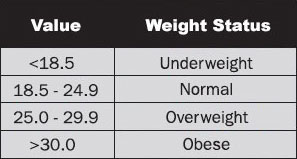
View the Mayo Clinic’s BMI Chart for Adults »
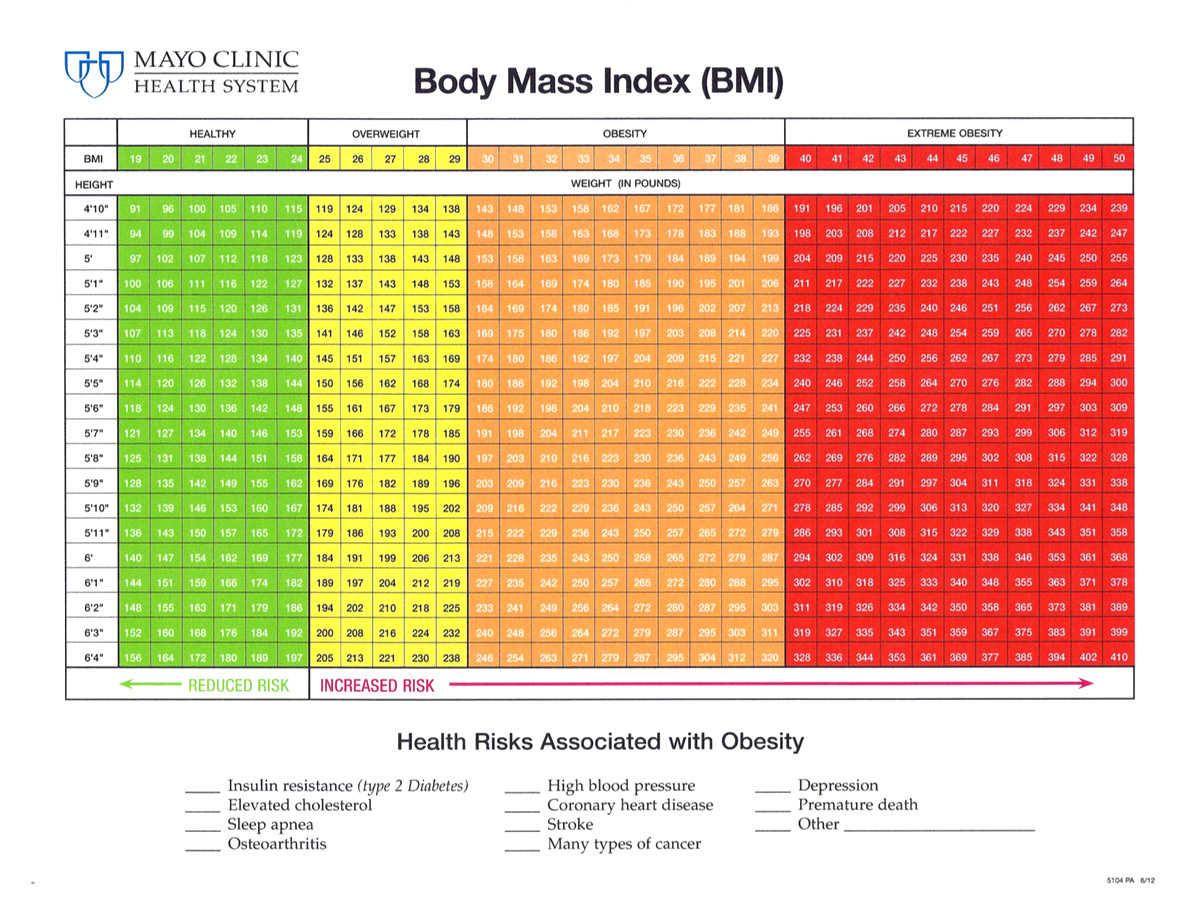
View the CDC’s BMI Chart for Girls »
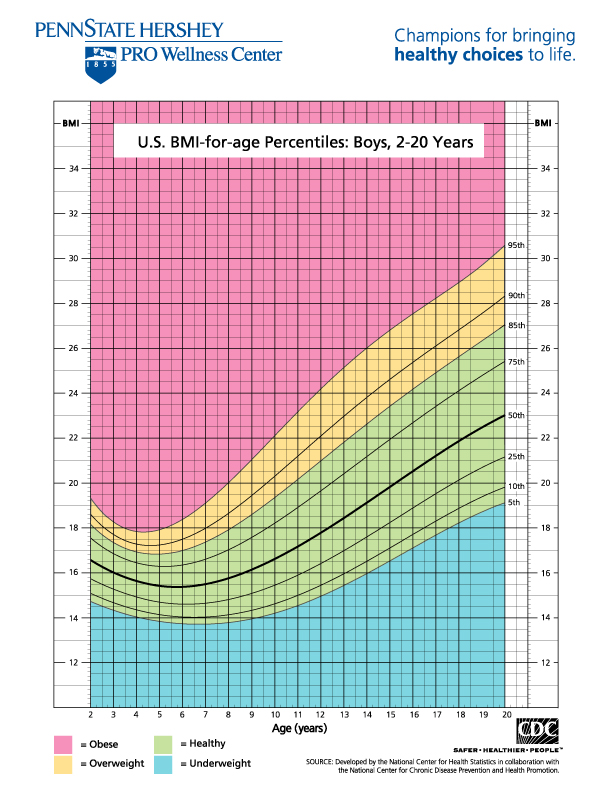
View the CDC’s BMI Chart for Boys »
Percent Body Fat:
Percentage of Body Fat Mass compared to Body Weight; metric scientifically and medically viewed as superior in accuracy over Body Mass Index in assessing degrees of fitness and/or degrees of obesity as it is a measurement based on muscle to fat ratio.
Segmental Lean Analysis:
Evaluates muscular development and distribution throughout your body, depicting amount of Lean Mass in each of the five individual segments. In each segment, you will find two bar graphs. The first bar graph depicts the amount of segmental lean mass in pounds. The second bar graph references your percentage of lean mass in comparison to segmental norms.
Trunk:
Cumulative area of the body including chest, abdomen, upper back, and lower back; also commonly referred to as torso.
Extracellular Water/Total Body Water Analysis (ECW/TBW):
Ratio of Extracellular Water to Total Body Water; an important indicator of body water balance. In a healthy state, your ECW/TBW ratio should fall within the range 0.360 to 0.390. A value closer to 0.360 (or below) is commonly observed in athletes and reflects more Intracellular Water, Lean Body Mass, and strong cellular nutrient retention. Conversely, a value nearing 0.390 is indicative of greater Extracellular Water, Body Fat Mass, inflammation/water retention, and dehydration. If your ECW/TBW ratio exceeds 0.400, it is recommended that you consult your physician.
Body Composition History:
Graphically tracks the historical trending of your body compositional changes, documenting personal Weight, Skeletal Muscle Mass, Percent Body Fat, and ECW/TBW Ratio values.
Visceral Fat Area (VFA):
Cross sectional value of fat located within the abdominal region surrounding internal organs such as the liver, pancreas, and intestines; previously measured only via computerized tomography (CAT) scans. Maintaining a VFA less than 100cm2 is strongly recommended, as abdominal obesity has a strong correlation to increased risk of cardiovascular disease, diabetes, cancer, and Alzheimer’s disease.
Body Fat – Lean Body Mass Control:
Based on your current body composition, the recommended change in Lean Body Mass and Body Fat Mass for achieving an optimal Percent Body Fat. The general consensus healthy Percent Body Fat range for a male is 10% – 20%, with 15% being classified as optimal for purposes of these calculations. For females, the healthy Percent Body Fat range is 18% – 28%, with 23% recognized as optimal.
Lean Body Mass (LBM):
Sum total of Total Body Water and Dry Lean Mass; also known as Fat Free Mass.
Segmental Fat Analysis:
Depicts how many pounds of fat are found within each of the five distinct segmental areas, as well as a percentage at the end of the bar graph comparing actual to optimal. For example, if the Right Arm segment reading is showing 115%, this indicates that the test subject has 15% more fat in the Right Arm when compared to the optimal standard for a person of the same height.
Basal Metabolic Rate (BMR):
Minimum amount of energy, or calories, required to sustain life at a resting state within a 24 hour period. Many commonly used formulas for calculating BMR are dependent on such factors as gender, age, height, and weight. The BMR provided in your results is directly correlated to only your measured Lean Body Mass, as Lean Mass consists primarily of muscle, the major metabolic engine of your body. BMR is independent of your daily activities, and increases as you add muscle mass and decreases when muscle is lost.
Body Cell Mass:
Total weight in pounds of all metabolically active tissues of the body (muscle and organs). As organs typically do not change in size, if your Body Cell Mass increases or decreases it can be attributed to the gaining or losing of muscle.
Leg Lean Mass:
Amount of cumulative muscle mass within your legs measured in pounds. Increasing and monitoring your Leg Lean Mass is vital, as with age it becomes increasingly difficult to develop muscle due to diminishing blood flow, depriving your musculature of nutrients. Multiple studies validate that regular performance of lower body exercises can enhance blood flow to the legs and assist in prevention of muscle deterioration.
Sarcopenia:
Degenerative loss of skeletal muscle mass and strength; typically associated with aging. Individuals who are physically inactive can lose as much as 3% to 5% of their muscle mass per decade after age 30. Although there is no generally accepted test or specific level of muscle mass for diagnosis, any loss of muscle mass is of consequence, because loss of muscle means loss of strength and mobility. Usually accelerates around age 75, and is a factor in the occurrence of frailty and the likelihood of falls and fractures in older adults.
Total Body Water/Lean Body Mass (TBW/LBM):
Measurement of the hydration level of your lean tissue, with a TBW/LBM reading of 73.3% being optimal. Hydration of your LBM is critical for good health, as water is the key to nutrient transport throughout your body.
Reactance:
Measured opposition to a change in current or voltage; reactance is a common measurement associated with how cells react to an electrical current. This value is of importance in bioelectrical impedance analysis (BIA) primarily for the purpose of obtaining the Phase Angle.
Whole Body Phase Angle:
Indicator of cellular membrane integrity, also a measurement of tissue health/resiliency. The average appropriate range of Phase Angle is 4 – 10o, where the higher the Phase Angle, the healthier the cellular integrity. Greater Phase Angle values are most commonly found in healthy individuals with strong cell membranes, as well as high Body Cell Mass and Lean Body Mass measurements. Low Phase Angles reflect cellular inability to store energy, and therefore a thinner cellular membrane.
Impedance:
Measurement in Ohms (Ω) of the strength and speed of an electrical current through the body. Bioelectrical impedance analysis is based on the fact that tissues with high water content act as a conductor of an electrical current, whereas fat tissue due to its density interferes with electrical conductivity. Therefore, the more fat there is in the body, the higher the impedance.
Ohm (Ω):
Electrical unit of resistance.
Kilohertz:
Unit of alternating current; identified by abbreviation kHz.